Read10
Error Handling & Debugging
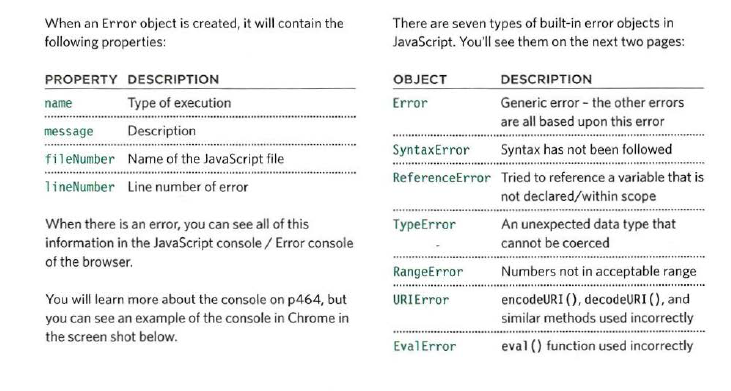
- When writing a long script, nobody gets everything right in their first attempt. The error messages that a browser gives look cryptic at first, but they can help you determine what went wrong in your JavaScript and how to fix it.
- To find the source of an error, it helps to know how scripts are processed.The order in which statements are executed can be complex; some tasks cannot complete until another statement or function has been run.
- The JavaScript interpreter uses the concept of execution contexts.There is one global execution context; plus, each function creates a new execution context. They correspond to variable scope.
- the JavaScript interpreter processes one line of code at a time. when a statement needs data from another function, it stacks (or piles) the new function on top of the current task.
- In the interpreter, each execution context has its own variables object. It holds the variables, functions, and parameters available within it. Each execution context can also access its parent’s v a ri ables object.
- If you are anticipating that something in your code may cause an error, you can use a set of statements to handle the error.This is important because if the error is not handled,the script will just stop processing and the user will not know why. So exception-handling code should inform users when there is a problem.
-
Error objects can help you find where your mistakes are and browsers have tools to help you read them.
- Now that you know what an error is and how the browser treats them,there are two things you can do with the errors.
- DEBUG THE SCRIPT TO FIX ERRORS.
- HANDLE ERRORS GRACEFULLY.
- Debugging is about deduction: eliminating potential causes of an error. WHERE IS THE PROBLEM? WHAT EXACTLY IS THE PROBLEM?
- The JavaScript console will tell you when there is a problem with a script,where to look for the problem, and what kind of issue it seems to be.
- The JavaScript console is just one of several developer tools that are found in all modern browsers.
- The Console option is selected.
- The type of error and the error message are shown in red.
- The file name and the line number are shown on the right-hand side of the console.
- console. info() can be used for general information.
- console.warn() can be used for warnings.
- console .error () can be used to hold errors.
- In browsers that support it, the console. table () method lets you output a table showing: • objects • arrays that contain other objects or arrays.
- Using the console. assert() method, you can test if a condition is met, and write to the console only if the expression evaluates to false.
- You can indicate that a breakpoint should be triggered only if a condition that you specify is met. The condition can use existing variables.
- the try statement throws an error (because the data cannot be parsed), the code in the catch code block will be run, and the error will not prevent the rest of the script from being executed.
- The catch statement creates a message using the name and message properties of the Error object.
- the finally statement adds a link that allows users to refresh the data they are seeing.
- If you try to use a string in a mathematical operation (other than in addition), you do not get an error, you get a special value called NaN (not a number).
- WRITING TABULAR DATA: In browsers that support it the console. table () method lets you output a table showing: • objects • arrays that contain other objects or arrays.
- THROWING ERRORS:If you know something might cause a problem for your script, you can generate your own errors before the interpreter creates them. If you try to use a string in a mathematical operation (other than in addition), you do not get an error, you get a special value called NaN (not a number).
BREAKPOINTS:
- You can pause the execution of a script on any line using breakpoints. Then you can check the values stored in variables at that point in time.
- If you set multiple breakpoints, you can step through them one-by-one to see where values change and a problem might occur.
- When you have set breakpoints,you will see that the debugger lets you step through the code line by line and see the values or variables as your script progresses.When you are doing this, if the debugger comes across a function, it will move onto the next line after the function.
-
- A pause sign shows until the interpreter comes across a breakpoint.When the interpreter stops on a breakpoint, a play-style button is then shown. This lets you tell the interpreter to resume running the code.
- Go to the next line of code and step through the lines one-by-one (rather than running them as fast as possible).
- Step into a function call. The debugger will move to the first line in that function.
- Step out of a function that you stepped into. The remainder of the function will be executed as the debugger moves to its parent function.
- A pause sign shows until the interpreter comes across a breakpoint.When the interpreter stops on a breakpoint, a play-style button is then shown. This lets you tell the interpreter to resume running the code.
- You can create a breakpoint in your code using just the debugger keyword. When the developer tools are open, this will automatically create a breakpoint.You can also place the debugger keyword within a conditional statement so that it only triggers the breakpoint if the condition is met.This is demonstrated in the code below.
HANDLING EXCEPTIONS:
- If you know your code might fail, use try, catch and finally.Each one is given its own code block.
- TRY: First, you specify the code that you think might throw an exception within the try block.
- CATCH: If the try code block throws an exception catch steps in with an alternative set of code.
- FINALLY:The contents of the finally code block will run either way - whether the try block succeeded or failed.